TRATAMIENTO DEL DOLOR

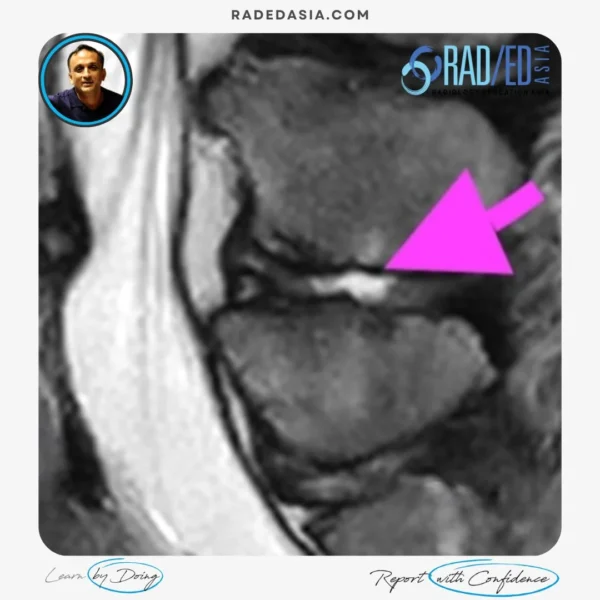
Baastrup’s disease is caused by the friction of two spinous processes rubbing against each other and can result in central back pain but its difficult to diagnose without imaging.
In the previous post we looked at the CT Findings in Baastrup’s Disease and this post looks at the MRI findings in Baastrup’s Disease particularly the features that cant be seen on CT such as Bursal inflammation. Soft tissue inflammation and Bone marrow oedema.
![]()

![]()
![]()
![]()
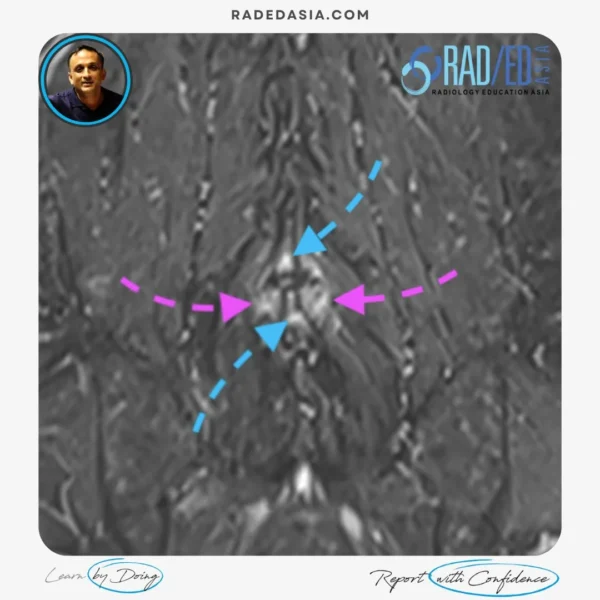
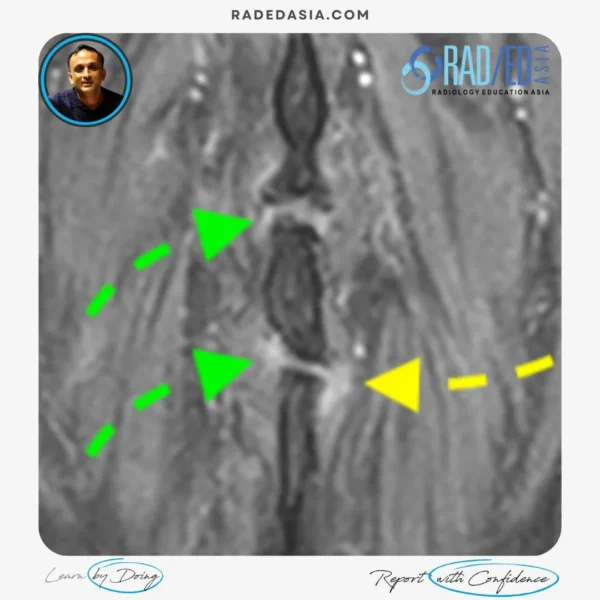
This is best appreciated on coronal T2FS or STIR sequences.
This is a reactive inflammatory response to the friction between the spinous processes and the adjacent bursal inflammatory changes.
![]()
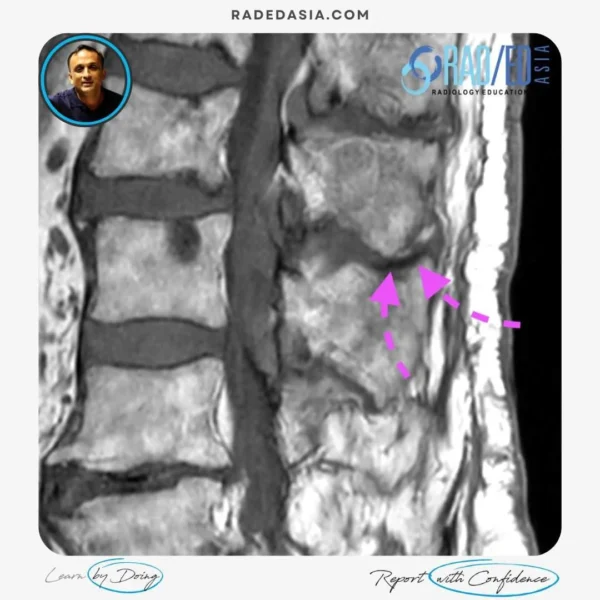
However, these are better appreciated on CT particularly in the early stages.
See our previous post on CT Findings in Baastrup's Disease for the CT appearance of subcortical sclerosis and osteophyte formation.
![]()