MRI BAASTRUP’S DISEASE: WHAT TO LOOK FOR
Baastrup’s disease is caused by the friction of two spinous processes rubbing against each other and can result in central back pain but its difficult to diagnose without imaging.
In the previous post we looked at the CT Findings in Baastrup’s Disease and this post looks at the MRI findings in Baastrup’s Disease particularly the features that cant be seen on CT such as Bursal inflammation. Soft tissue inflammation and Bone marrow oedema.


- Spinous processes broaden in the superior inferior axis (Pink lines).
- There is no measurement for this but compare with spinous processes in the upper lumbar spine as a reference.
- The interspinous space will also narrow (Blue arrow) as the spinous processes approximate each other.
- Again, there is no measurement for this but compare with interspinous distance in the upper lumbar spine as a reference.
- These are both best appreciated on sagittal T1 sequences.
- See also our previous post on CT Findings in Baastrup's Disease for the CT appearance of broadening of the spinous processes.

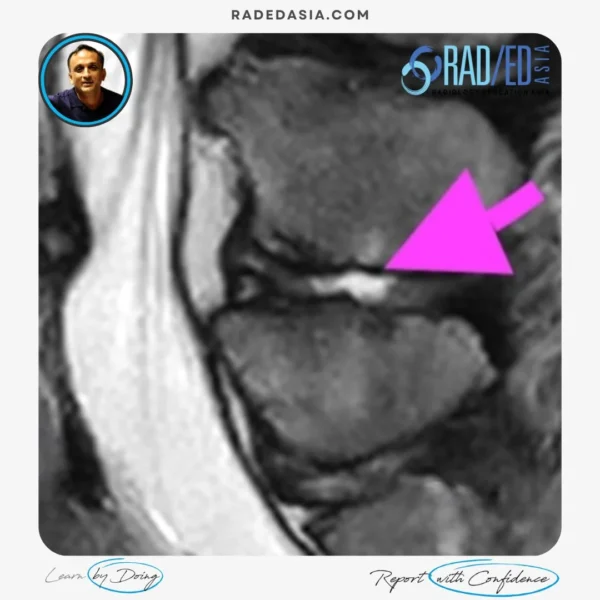
- Inflammation and fluid can accumulate in the interspinous region.
- Look for high signal in between the spinous processes.
- This is best appreciated on sagittal or coronal T2FS or STIR sequences.

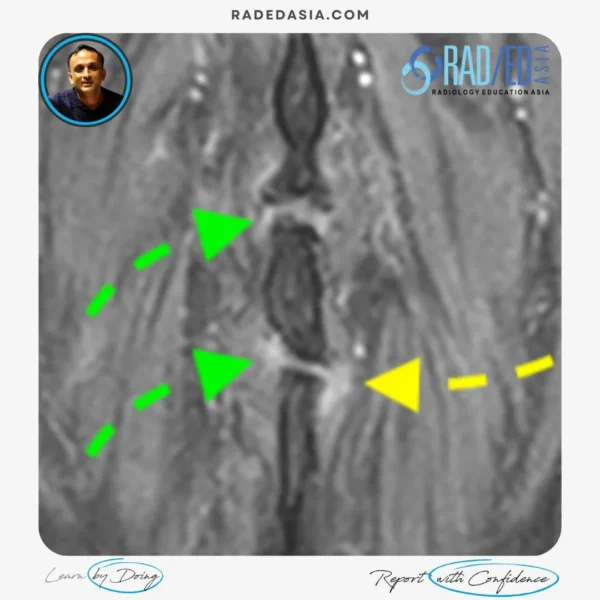
- Inflammatory changes (Yellow and Green arrows) can extend into the adjacent soft tissues from the inflamed interspinous region.
- Look for high signal in between the spinous processes.
- This is best appreciated on coronal T2FS or STIR sequences.

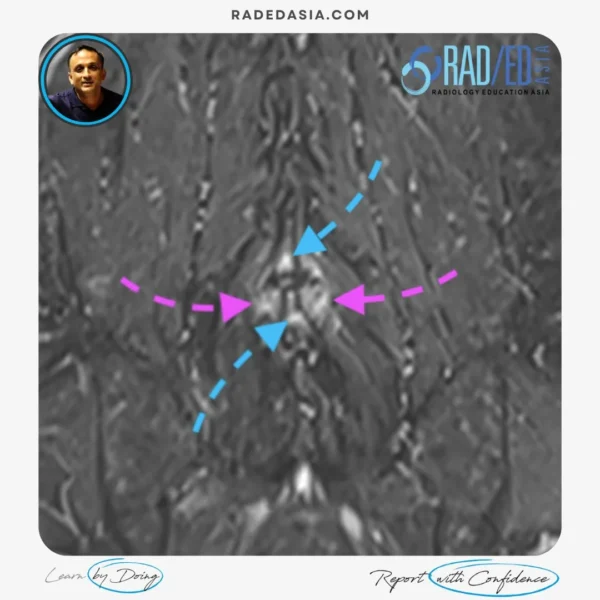
- Bone marrow oedema (Blue arrows) may be seen in the spinous processes.
- Look for high signal in the spinous processes.
This is best appreciated on coronal T2FS or STIR sequences.
This is a reactive inflammatory response to the friction between the spinous processes and the adjacent bursal inflammatory changes.
- Note also inflammation (Pink arrows) extending into the adjacent soft tissues from the inflamed interspinous region.

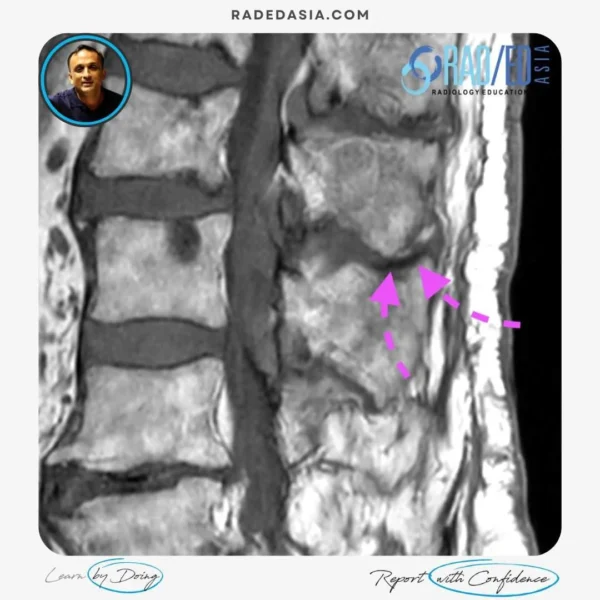
- Subcortical sclerosis of the spinous processes can occur due to chronic rubbing of the two spinous processes against each other and marginal osteophytes can also form.
- For sclerosis look for very low signal (Pink arrows)on T1 and T2 scans in the subcortical region of either or both spinous processes.
However, these are better appreciated on CT particularly in the early stages.
See our previous post on CT Findings in Baastrup's Disease for the CT appearance of subcortical sclerosis and osteophyte formation.

Learn more SPINE & SIJ MRI and CT Imaging in our guided online Mini-Fellowships.
Click on the image below for more information.
For all our other current MSK MRI & Spine MRI
Online Guided Mini Fellowships.
Click on the image below for more information.
- Join our WhatsApp RadEdAsia community for regular educational posts at this link: https://bit.ly/radedasiacommunity
- Get our weekly email with all our educational posts: https://bit.ly/whathappendthisweek


